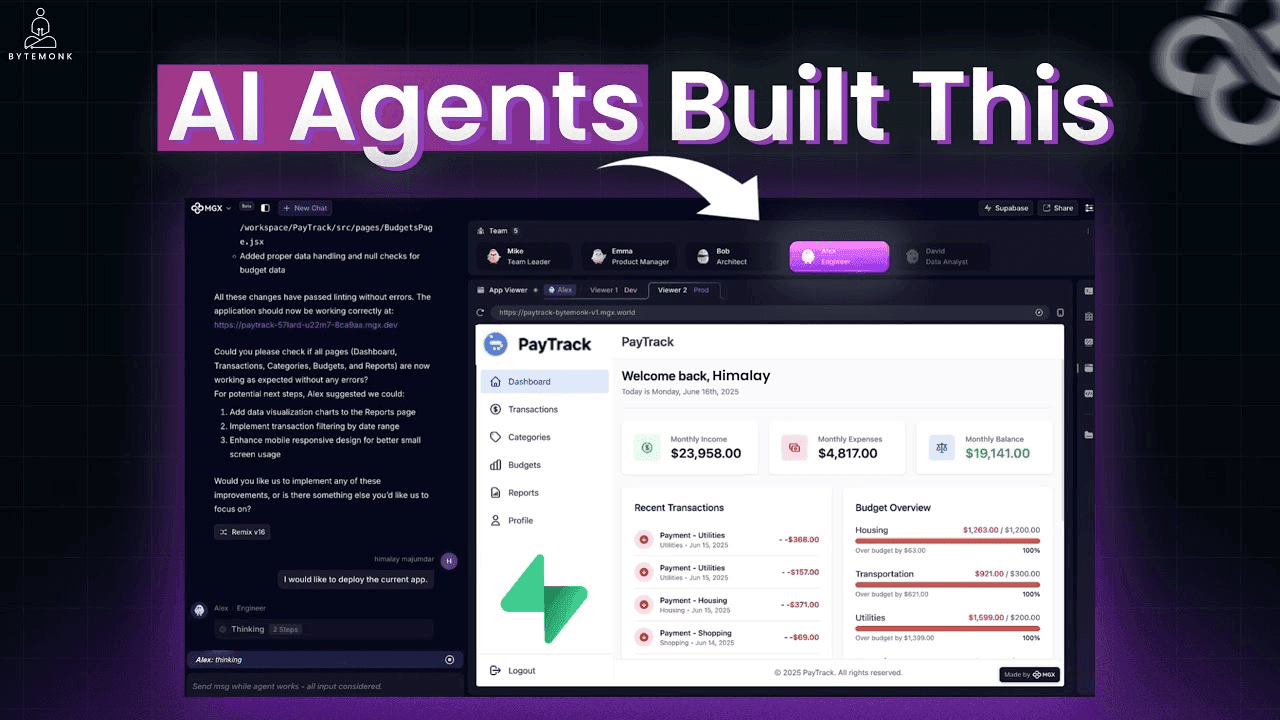
Build Better Dashboards with AI in Atoms
Skip wrestling with BI tools and dashboards nobody uses. Describe your metrics and questions, and Atoms builds a clear web dashboard your team can actually read and act on daily.

Start free. No BI experience required.


Feature Highlights
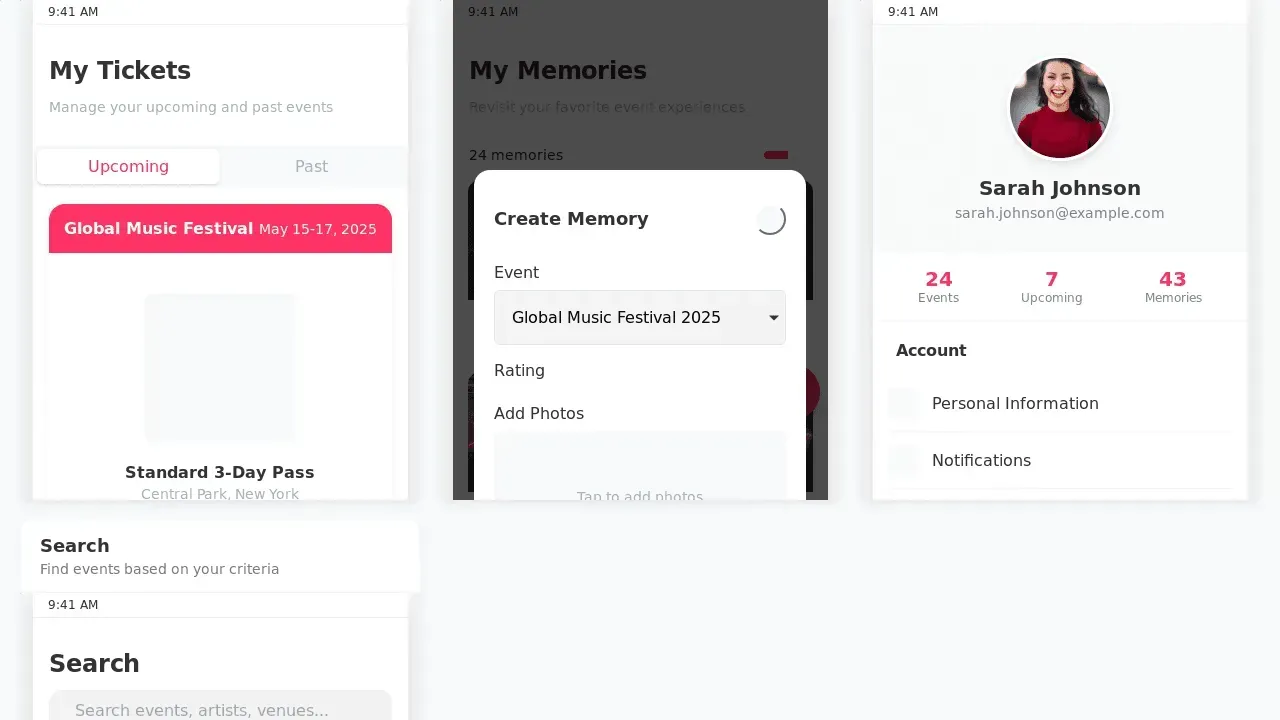
Live Rendering
Instant updates with images, branch support, undo at any step and one click deploy
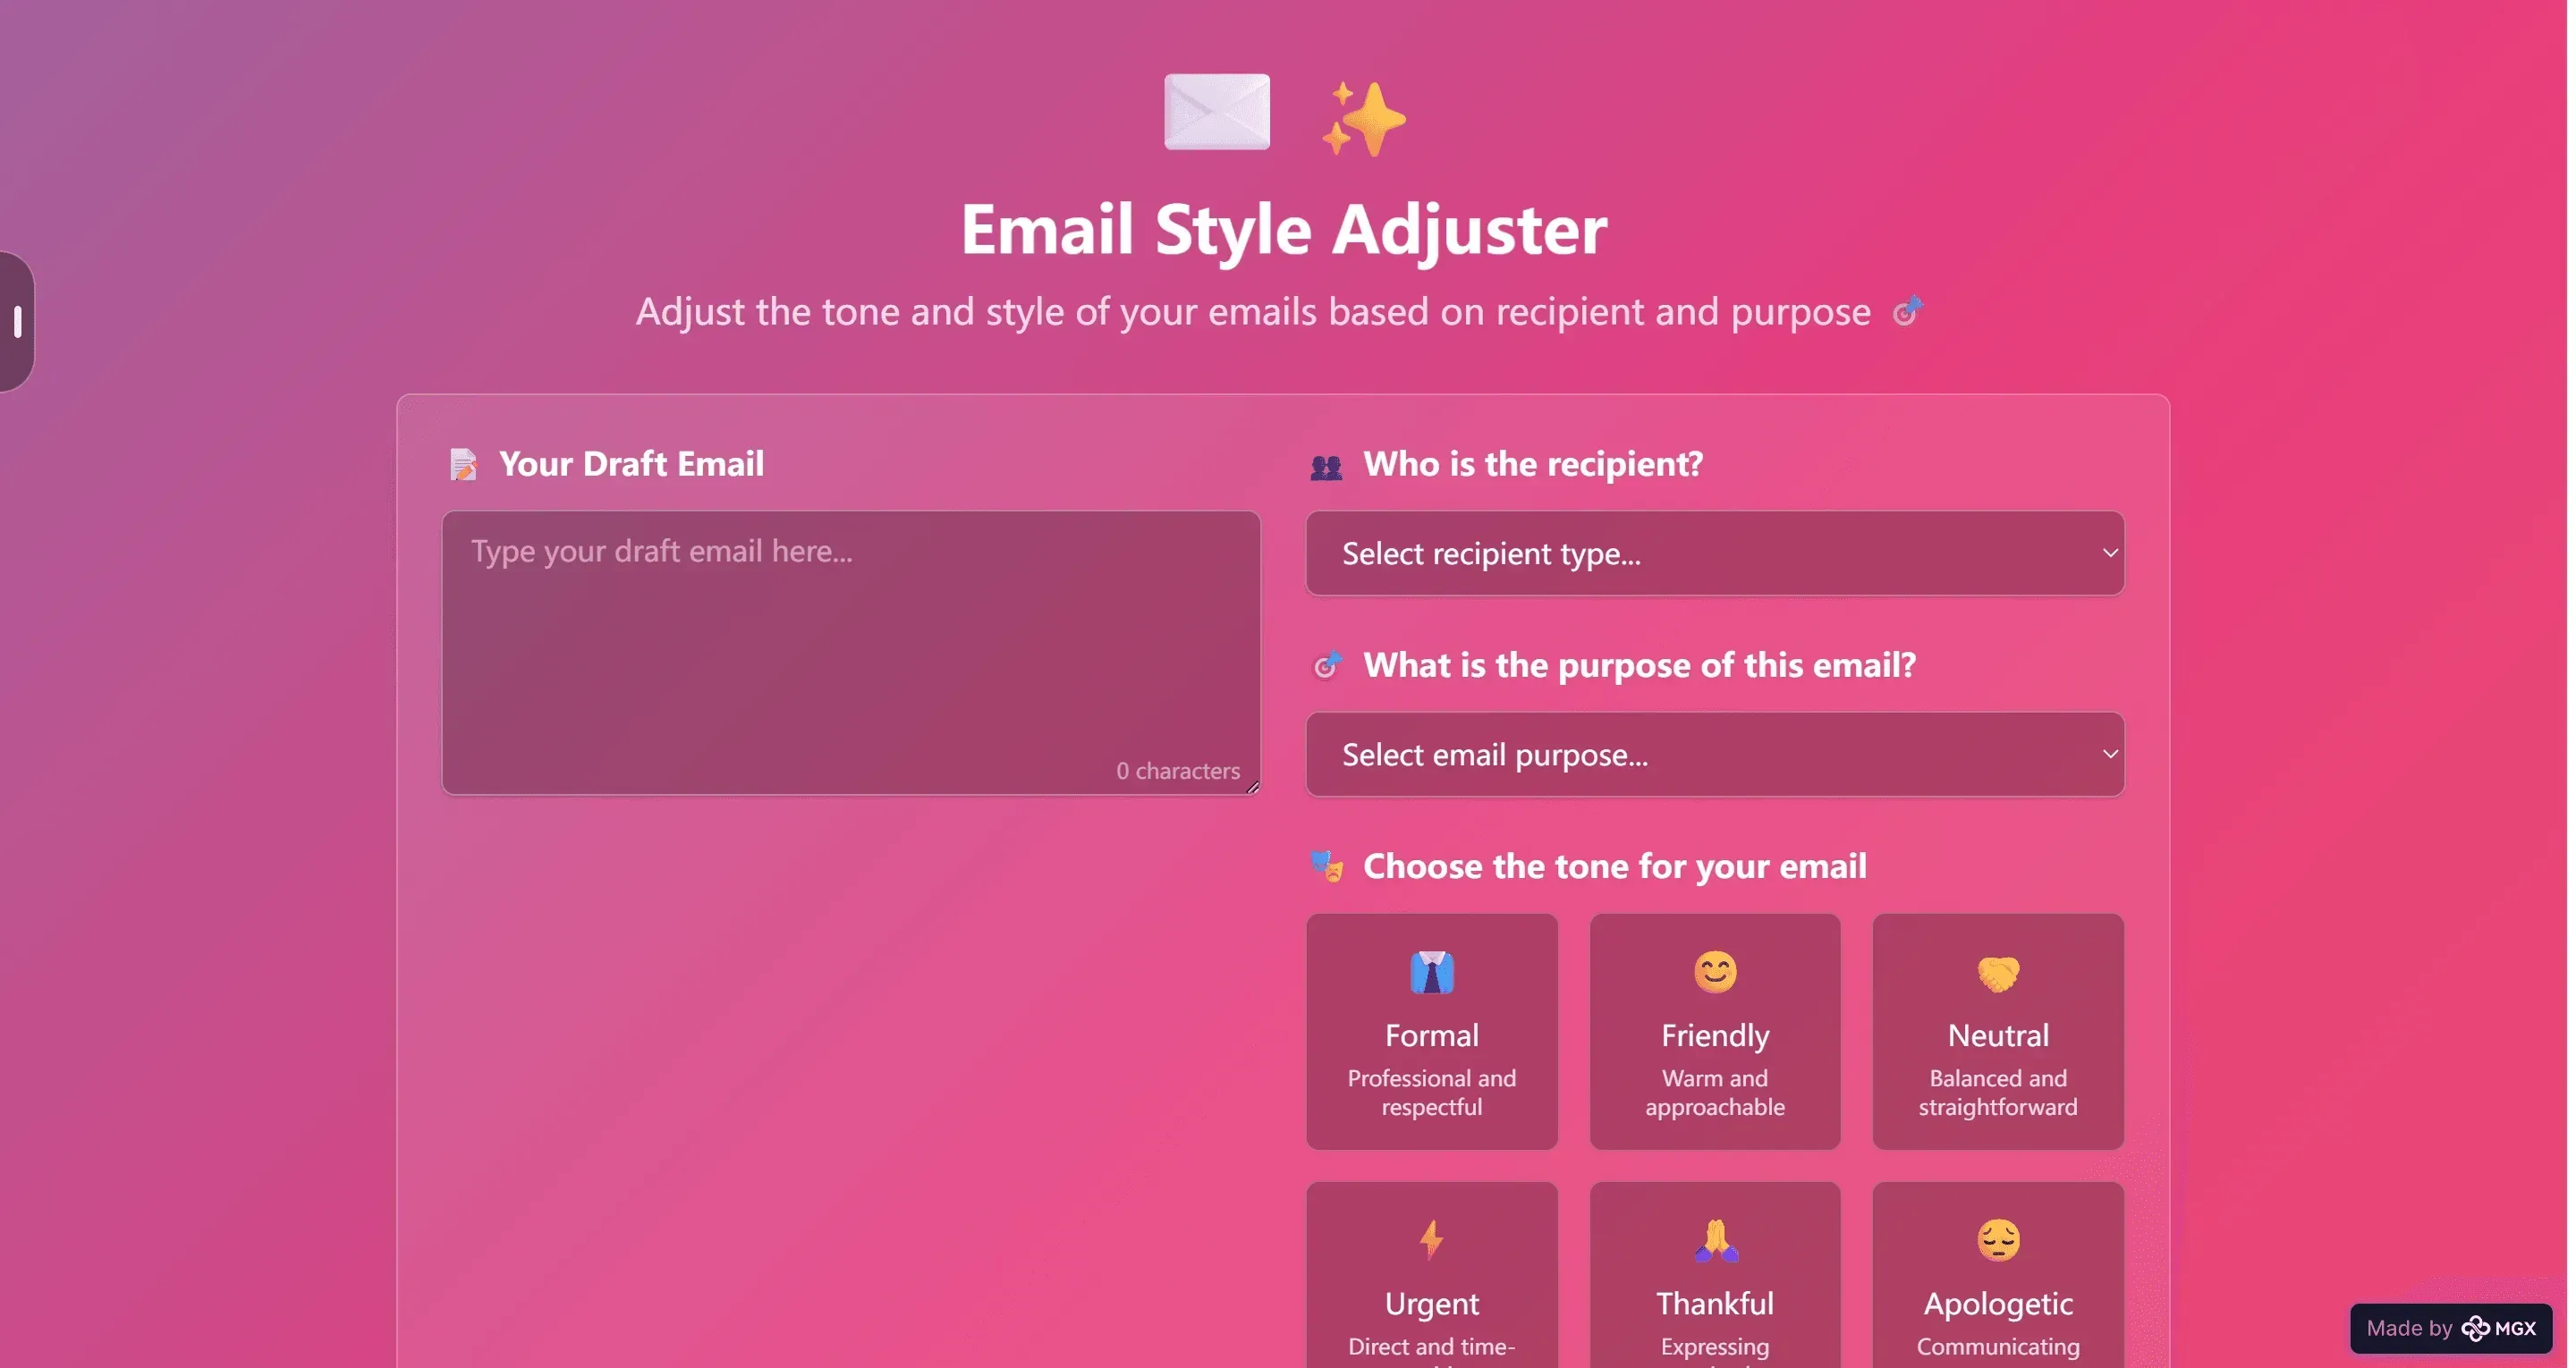
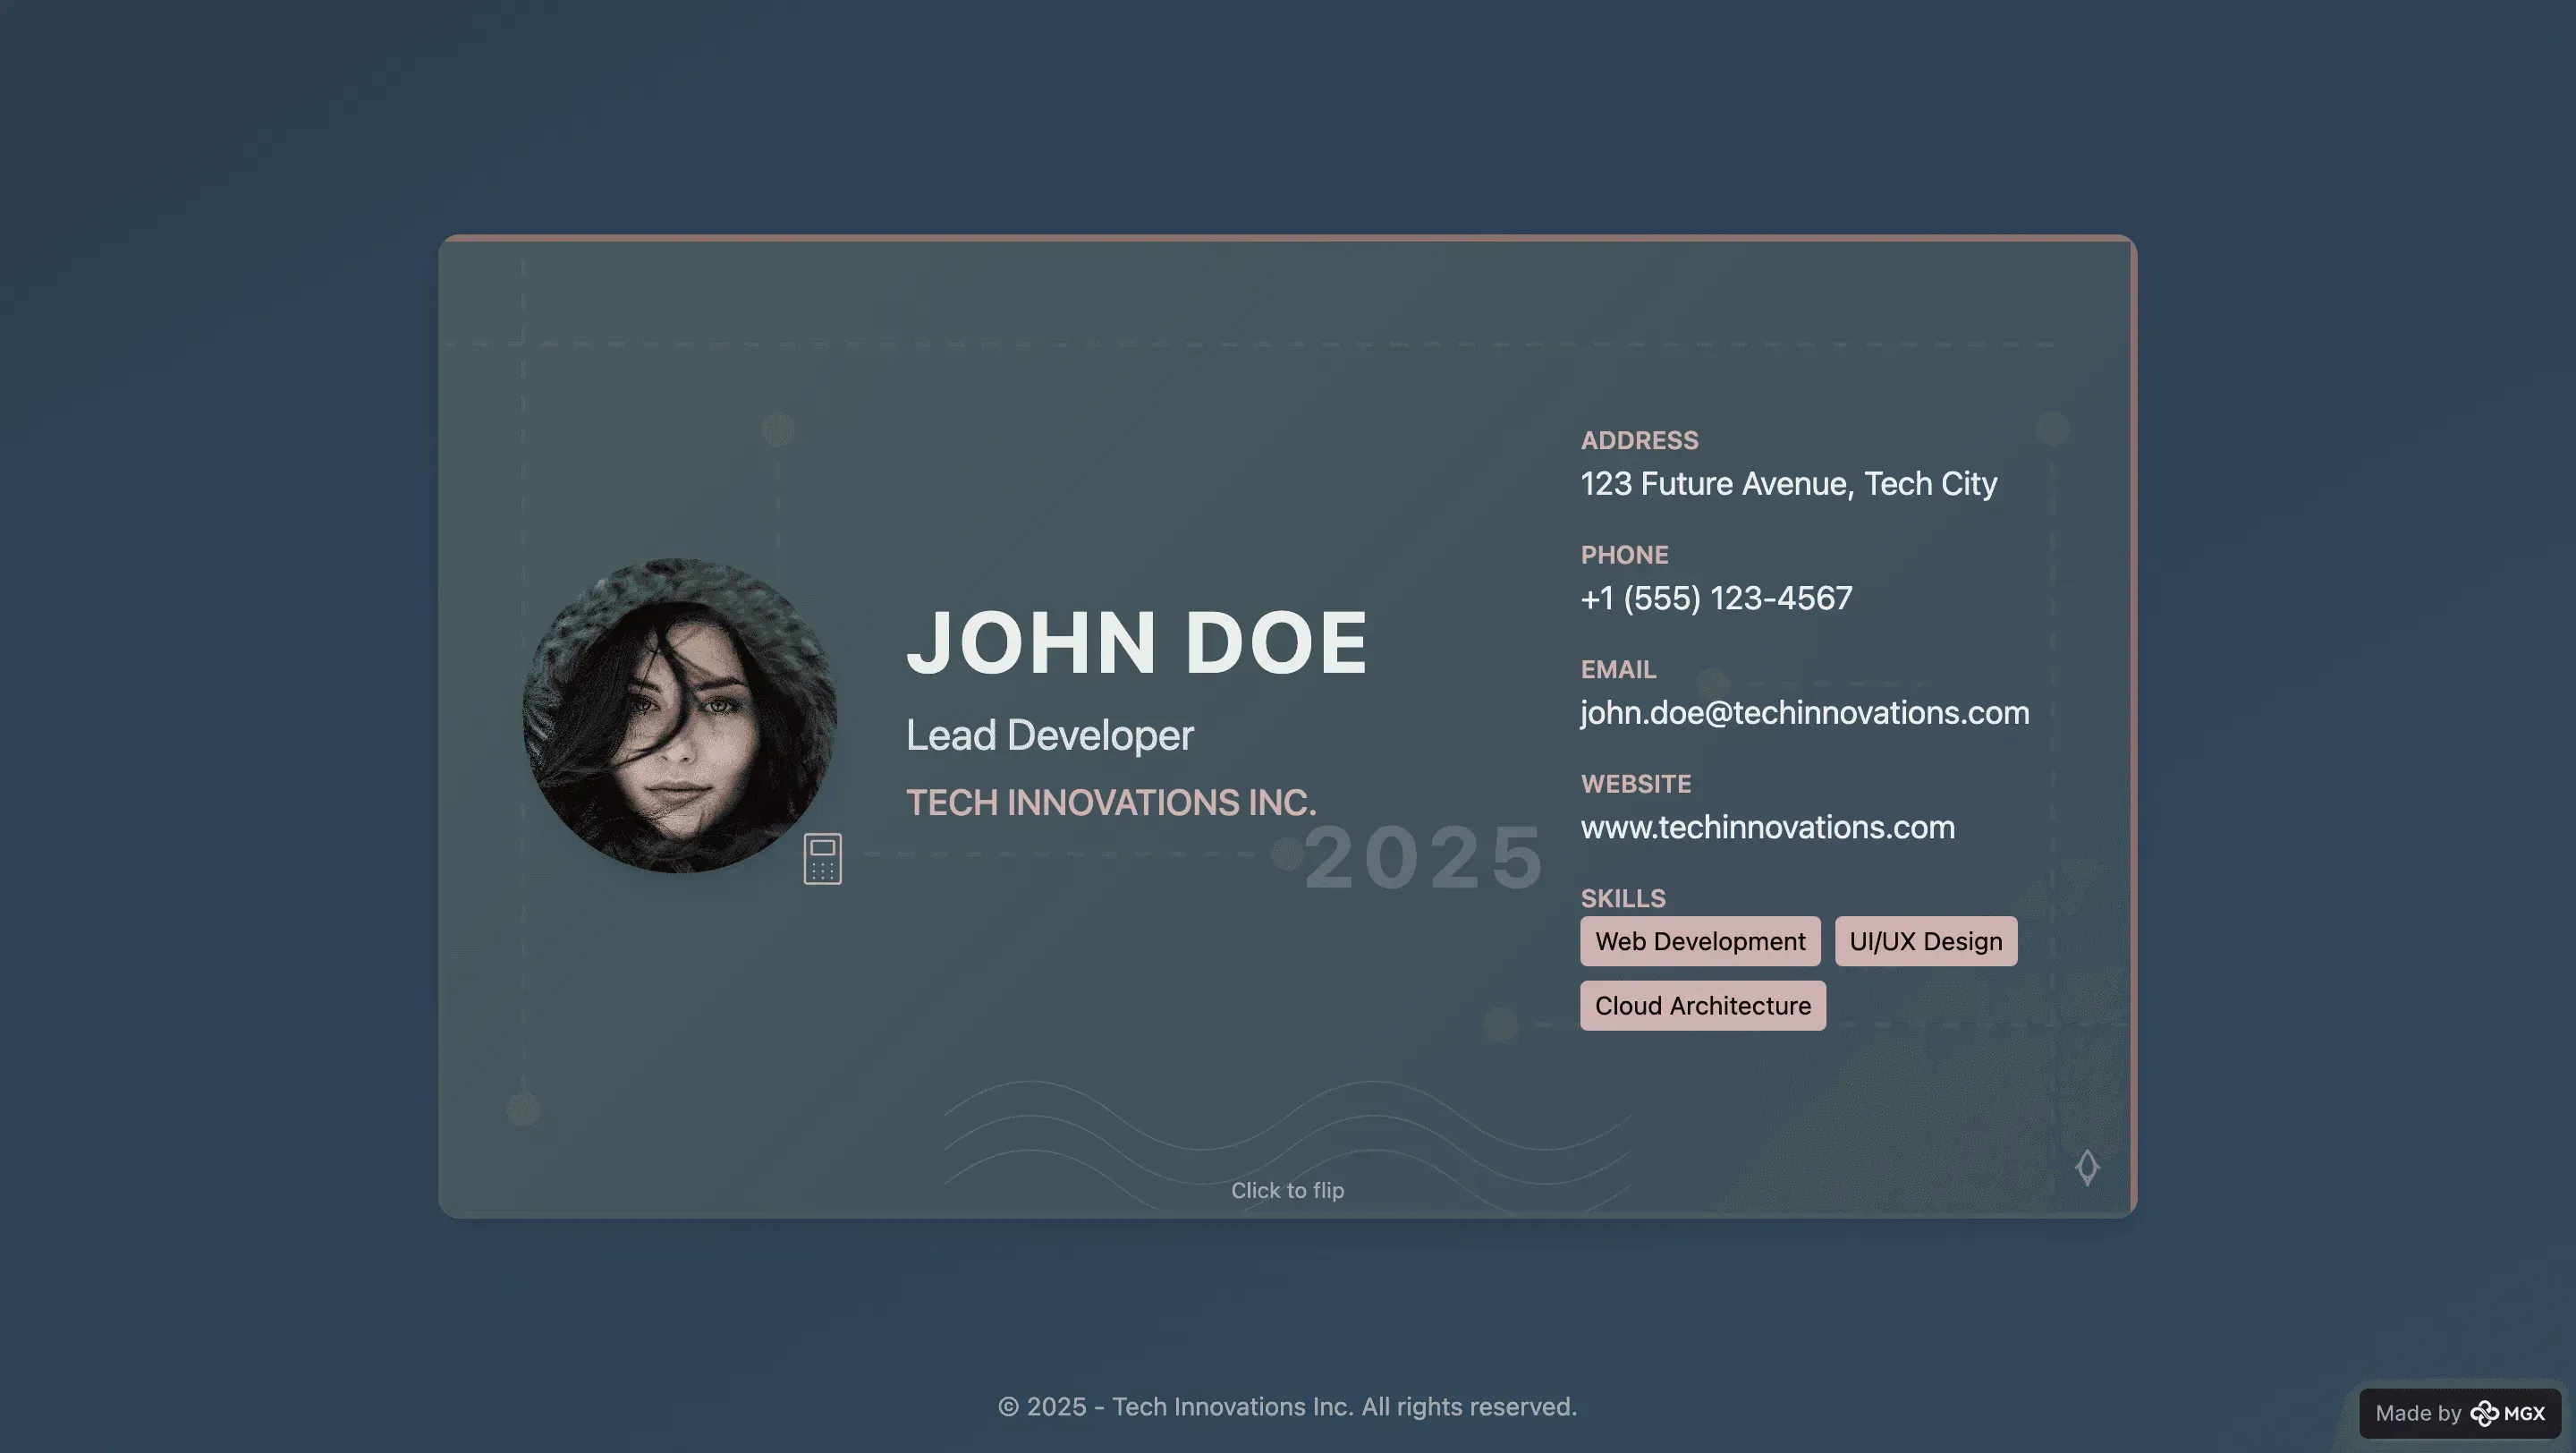
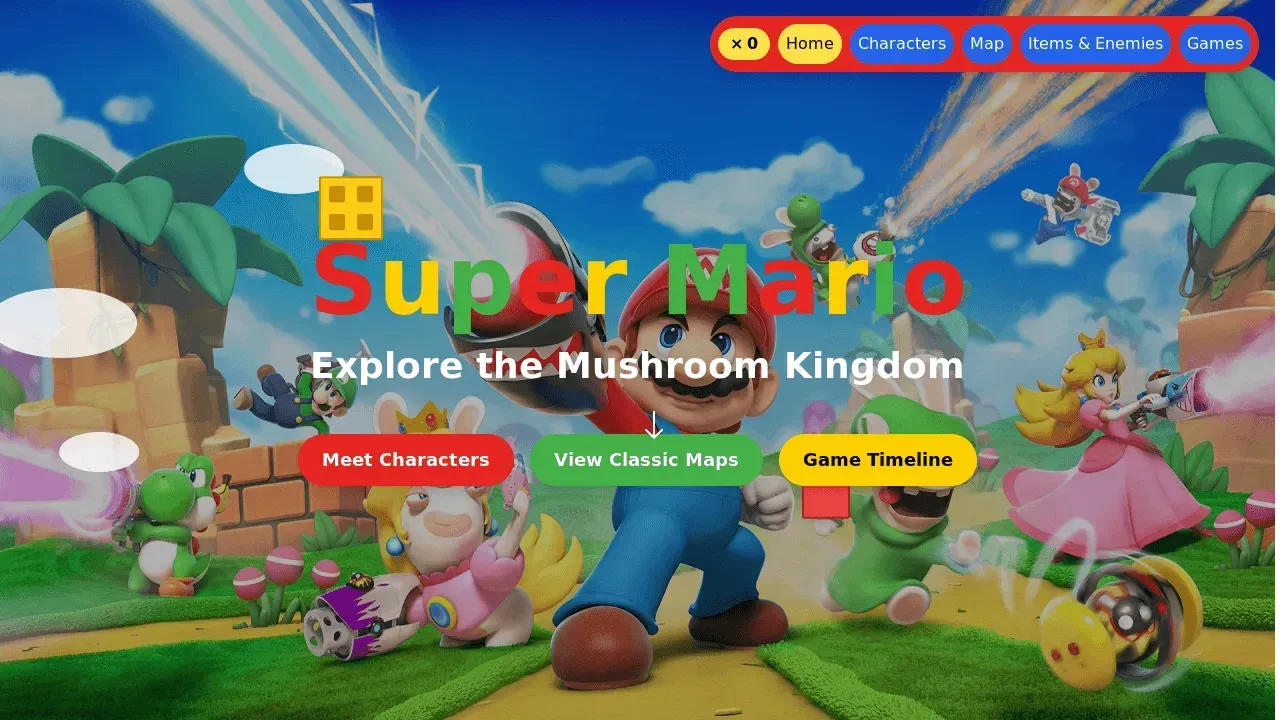
Elegant Design
Built‑in templates and guidelines for refined interfaces
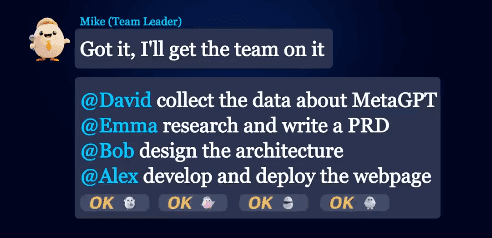
Multi‑Agent Workflow
Agents debate and refine plans before generating reliable code
Supabase Backend
Natural language to schemas and APIs without manual setup
Design
Select elements, describe changes and apply precise updates
Related Tools
Explore more AI-powered builders for every use case
Artist Website Builder
Describe your art portfolio or store and get a live, deployable website with gallery, ecommerce, and custom domain — built in minutes.
AI MVP Showcase Page
Turn your MVP into a clear, focused showcase page that collects real feedback and early users.
Band Website Builder
Describe your band site in plain language and get a deployed music website with merch, tour dates, and streaming links.
AI Agency Website Builder
Use AI to build a clear agency website that helps you request a proposal.
AI Coding Assistant
Work with an AI coding partner that understands your project, not just the current line.
Code Changer AI
Use AI to refactor, modernize, and clean your codebase without risky manual rewrites.
Loved by thousands of product creators


How to build
Pricing
Free to start. Flexible to scale.Give Your Data a Home People Will Actually Use
Stop sending screenshots of spreadsheets. Use Atoms to build dashboards that answer real questions.
