
Most builders have the same quiet fear after they publish: "Is anyone actually visiting my site?"
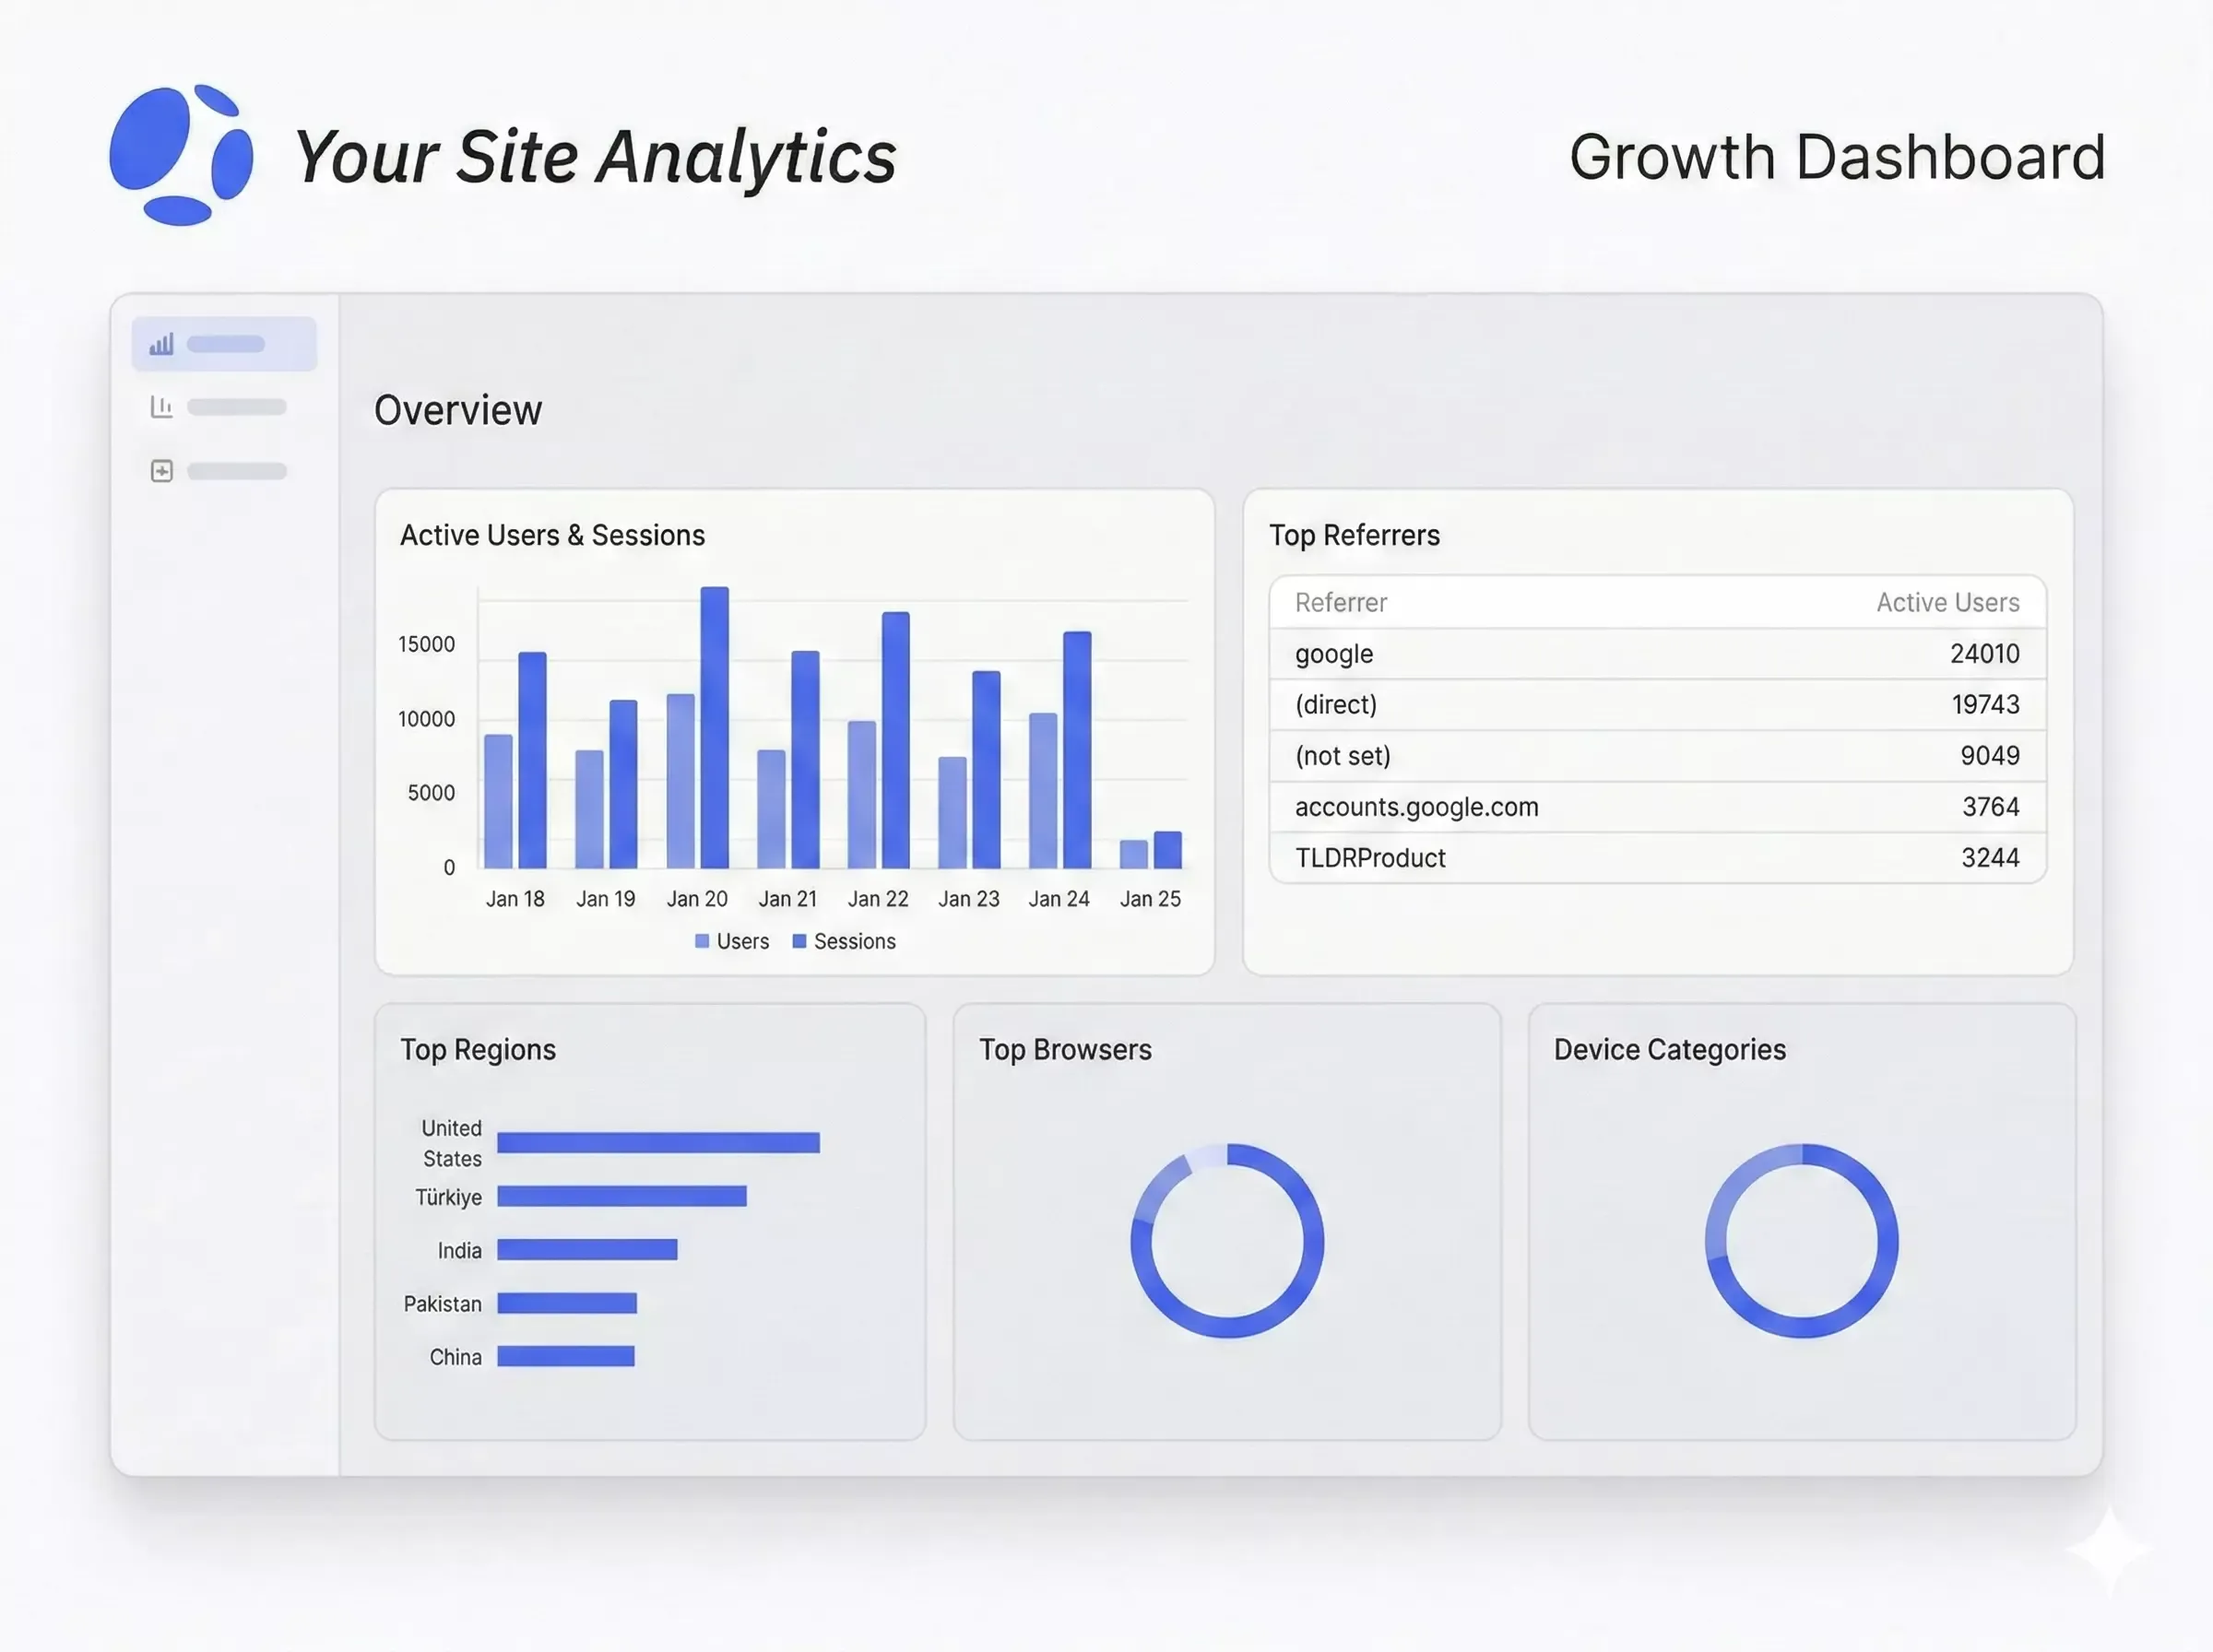
Today, we're launching Growth Dashboard in Atoms: a lightweight, built-in analytics view powered by GA4 that helps you see real traffic, understand what content gets attention, and get a clearer signal on whether your site is entering a "growth phase".
It's intentionally simple. No analytics jargon. No long setup guide. No OAuth flow.
Just a clear snapshot that answers three practical questions:
- Are people visiting?
- Is my conent, blog, or SEO doing anything yet?
- Am I ready to take the next growth step?
Why we built this
Atoms helps you ship quickly. But shipping is only step one.
After publication, most builders enter a confusing zone:
- You share the link… and hear nothing.
- You tweak SEO titles… but can't tell if it made a difference.
- You post on socials… and can't confirm if visitors came from that push.
- You don't know what to work on next, because you don't know what's working now.
That's not a motivation problem. It's a visibility problem.
Growth Dashboard gives every builder a clear, usable view of the first signals—so you can move from "I launched" to "I'm improving."
What Growth Dashboard is (and what it isn't)
Growth Dashboard is a Growth Snapshot.
It's built to give you quick clarity, not to replace professional analytics tooling.
It is:
- A simple dashboard inside Atoms
- Powered by GA4 metrics via GA4 Data API
- Focused on basic growth perception: traffic, geography, and top pages
- Designed to help you decide what to do next
It is not:
- A real-time analytics console
- A custom report builder
- A deep attribution or funnel analysis tool (yet)
If you're used to complex BI dashboards, this will feel minimal. That's intentional. The goal is to reduce decision friction, not add another tool you have to learn.
The "one-click" approach: no OAuth, no GA4 setup
Analytics setup is usually where momentum dies.
So in this first version, we chose a strategy that removes almost all onboarding costs:
- Atoms creates a GA4 property for you (platform-managed).
- We fetch basic metrics through the GA4 Data API.
- No user OAuth authorization is required.
- No manual copy-pasting scripts into .
This is a phase 0 strategy: it optimizes for speed, adoption, and learning. It lets you get value fast, and it gives us a reliable baseline to improve future growth capabilities.
What you'll see in the dashboard
This first release covers the minimum set of views that help you confirm "my site is running" and start making smarter content decisions.
Traffic Overview: "Is my site alive?"
This section answers the simplest question: Are there real users visiting?
You'll typically see:
- Active users for the selected period
- A trend line for recent days (often 7-day / 30-day views)
- A quick sense of whether traffic is:
- Flat (no distribution yet)
- Spiky (one-off shares)
- Sustained (early momentum)
How to use it
- If you see 0–a few users: your biggest bottleneck is distribution. Share the site in places where your audience already is.
- If you see spikes: identify what caused them and repeat that channel.
- If you see steady growth, you're ready to optimize content and conversion, not just traffic.
Geo Distribution: "Where are visitors coming from?"
This section helps you validate that your traffic looks real and relevant.
You'll see:
- A list of top countries / regions
- Active users by location
This is not about "going global." It's about sanity checking:
- Are visits from the markets you expect?
- Do you see meaningful diversity (not just your own testing traffic)?
- Did a specific community share your site in a region you didn't anticipate?
How to use it
- If geography doesn't match your target audience, revisit:
- language, keywords, distribution channels, or communities you posted in
- If you see unexpected regions growing, you may have discovered a new pocket of demand.
Top Pages: "What content is actually getting attention?"
This is the most actionable part of the MVP.
You'll see:
- Your top pages
- Basic behavior indicators (views / active users depending on the current view)
This helps you answer:
- Which pages are pulling users in?
- Which pages might deserve improvement, expansion, or stronger CTAs?
- Which pages are invisible (and why)?
How to use it (practical playbook)
- Double down on winners:
- Add internal links pointing to them
- Refresh headings and clarity
- Strengthen CTAs
- Fix "high view, low intent" pages:
- Clarify the offer above the fold
- Add a next step (demo, signup, contact)
- Promote pages that matter but aren't seen:
- Share them directly
- Improve title/meta
- Add links from your homepage and high-traffic pages
What actions should you take after you see data?
Here's a simple, repeatable routine that works well for early-stage sites:
A weekly 15-minute growth loop
- Check Traffic Overview
Is traffic flat, spiky, or sustained? - Check Top Pages
Which page is #1 this week? Why? - Make one change
Update one page, publish one new page, or improve one CTA - Share one thing
A post, a community share, a partner message—something that can drive one more traffic pulse - Repeat
Growth is mostly consistent iteration, not heroic rewrites
This dashboard is designed to support exactly that: small actions guided by real signals.
Data notes and limitations (clear expectations)
Because this dashboard is powered directly by GA4:
- Data can be delayed due to GA4 processing
- Numbers are best used for trend direction, not minute-by-minute decisions
- The MVP does not include:
- Custom reporting
- Advanced segmentation
- Funnels / conversion paths
- Channel attribution deep dives
If you need those today, GA4 is still there for power users. Growth Dashboard is the "daily driver" view you can understand at a glance.
What's next for Growth in Atoms
This launch is the foundation. The real goal is bigger than charts.
We want Atoms to help builders move through a full growth journey:
- From first visits → to repeat visits
- From content → to conversion
- From guesses → to experiments you can measure
This version helps us validate the most important first step:
Do builders actually use a dashboard when it's built-in and easy?
And does it increase understanding and action?
From here, we'll build based on real usage and feedback.
How to try it
- Open your project in Atoms after building a website
- Go to Growth
- Click Connect analytics
- Check back once GA4 data is available
If you've never used analytics before, this is the best place to start. If you already know GA4, this gives you a faster, cleaner daily view inside your build workflow.
Closing thought
Growth Dashboard is our first step toward making growth feel less like guessing—and more like a simple loop: publish, observe, improve, repeat.
Introducing Growth Dashboard: now you can see what's working—right where you build.
